- Kshitij Bhatnagar
- Projects
- Gaussian Visualizer
Gaussian Visualizer
Move the mean, watch the defects appear
Built by Kshitij Bhatnagar
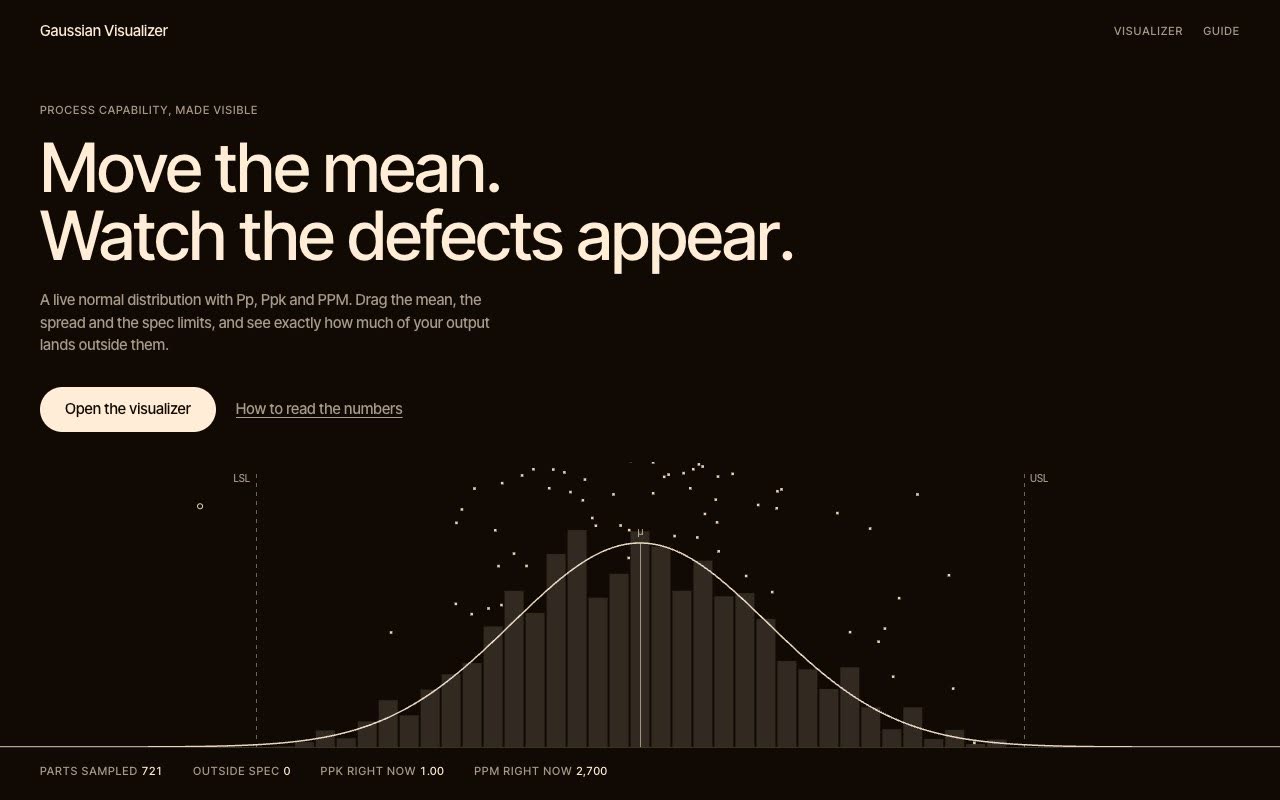
An interactive normal distribution for process capability: drag the mean, the spread and the spec limits right on the curve and watch Pp, Ppk, PPM and yield update live.
The spark
Understanding process capability from static textbook curves never clicked for me. You could not feel how the numbers actually move as the process shifts.
What was built
I rebuilt it as its own small app: an SVG chart where the spec limits, the mean and the shoulder of the curve are draggable handles, live Pp, Ppk, PPM and yield with a plain-language verdict, and a hero where simulated parts fall into a histogram as the process drifts, so defects visibly land outside the limits. It is one static page with no dependencies, served on this domain.
Architecture
- One static HTML file, no build and no dependencies
- Accurate tail maths, so the Six Sigma preset reads 3.4 PPM
- Standalone Vercel app proxied to /gaussian-visualizer here
Highlights
- Drag the limits, mean and σ on the curve
- Live Pp, Ppk, PPM and yield
- Presets from a 20 mm bolt to Six Sigma
- Keyboard accessible handles